
Trident Share Price Target 2025: This article is going to mainly focus on Trident Share Price Target 2025, 2026, 2028, 2030, 2040 and 2050. Along with this, we will also discuss the company’s Fundamental, sentiment, Income Report, Share Price history, and Quarterly Report. Our analysis will help investors in taking the right decision.
About Trident
Trident Group is an Indian conglomerate known for its diverse business ventures including textiles, paper, chemicals and energy. The company was founded in 1990 by Rajinder Gupta, headquartered in Ludhiana, Punjab. Trident is a leading manufacturer of terry towels, yarns, bedsheets and paper products.
The company is spread across more than 150 countries with more than 15 offices globally. The company focuses on sustainability, using eco-friendly practices such as water conservation and renewable energy in its production processes. Trident’s commitment to quality and innovation has earned it numerous industry awards and a strong reputation worldwide.
Trident Fundamental
Trident Limited is a leading textile company. It is a mid cap company with ₹18743 crore. The company is listed on both NSE and BSE with the code TRIDENT and 521064 respectively. Reserves and surplus of ₹3799.50 crore suggest good financial support, which reflects the company’s strong position to fight adverse conditions.
Trident total revenue for FY24 was Rs6867 crore and net profit was Rs 349.99 crore, registering a growth of 8.02% and -20.74% respectively. The Company’s ROE (7.52%) and ROCE (10.4%) are moderate but can improve with better profit growth. The Company’s debt to equity ratio (0.38) indicates manageable debt levels.
Also Read: Then don’t say that I didn’t tell you, buy Waaree Energies shares right now.
The company’s price-to-earnings (P/E) ratio is 58.38 which is significantly higher than the industry’s P/E of 33.28, which indicates that the company is overvalued. Its P/B ratio (4.37) indicates premium pricing relative to book value. The company is paying a dividend of 0.98% to its shareholders and its EPS (TTM) is ₹0.63, which indicates modest profitability.
| Description | Value |
|---|---|
| Company Name | Trident Ltd. |
| Sector | Textile |
| Established | 1990 |
| Website | tridentindia.com |
| Listing At | BSE, NSE |
| BSE Code | 521064 |
| NSE Code | TRIDENT |
| Mkt Cap | ₹18743Cr |
| Reserves and Surplus | ₹3799.50Cr |
| ROE | 7.52% |
| ROCE | 10.4% |
| 52 Week High | ₹52.90 |
| 52 Week Low | ₹31.07 |
| P/E Ratio (TTM) | 58.38 |
| Industry P/E | 33.28 |
| P/B Ratio | 4.37 |
| Face Value | 1 |
| Book Value Per Share | ₹8.41 |
| EPS (TTM) | ₹0.63 |
| Dividend Yield | 0.98% |
| Debt to Equity | 0.38 |
| Total Revenue | ₹6867Cr |
| Revenue Growth | 8.02% |
| Net Profit (Anual) | ₹349.99Cr |
| Profit Growth | -20.74% |
Returns in Past Year
| Year | Returns (%) |
|---|---|
| 2023 | 5.99% |
| 2022 | -35.80% |
| 2021 | 438.89% |
| 2020 | 47.76% |
| 2019 | 0.90% |
| 2018 | -25.73% |
| 2017 | 55.21% |
| 2016 | -0.52% |
| 2015 | 125.29% |
| 2014 | 41.21% |
| 2013 | 100% |
| 2012 | -7.14% |
| 2011 | -42.69% |
| 2010 | 16.33% |
Also Read: Tata Gold Price Target, money printing machine for small investors.
Trident Price Target 2025
The current sentiment of Trident is showing bearish. the Trident share price target 2025 is going to be between Rs 20 to Rs 56.
| Year | Price Target (Min) | Price Target (Max) |
|---|---|---|
| January | ₹24 | ₹38 |
| February | ₹28 | ₹42 |
| March | ₹23 | ₹40 |
| April | ₹20 | ₹37 |
| May | ₹24 | ₹41 |
| June | ₹28 | ₹43 |
| July | ₹32 | ₹47 |
| August | ₹29 | ₹45 |
| September | ₹33 | ₹47 |
| October | ₹36 | ₹51 |
| November | ₹35 | ₹52 |
| December | ₹38 | ₹56 |
Trident Share Price Target 2026
According to market experts, the price target of Trident for 2026 is going to be between Rs47 to Rs 83.
| Year | Price Target (Min) | Price Target (Max) |
|---|---|---|
| 2026 | ₹47 | ₹83 |
Also Read: Venus Pipes Share Price Target 2023 to 2050
Trident Share Price Target 2028
According to market experts, the price target of Trident for 2028 is going to be between Rs 96 to Rs 134.
| Year | Price Target (Min) | Price Target (Max) |
|---|---|---|
| 2028 | ₹96 | ₹134 |
Trident Share Price Target 2030
According to market experts, Trident Share Price Target 2030 is going to be between Rs150 to Rs 195.
| Year | Price Target (Min) | Price Target (Max) |
|---|---|---|
| 2030 | ₹150 | ₹195 |
Trident Share Price Target 2040
According to the past trend of the company, Trident Share Price Target 2040 is going to be between Rs 420 to Rs 498.
| Year | Price Target (Min) | Price Target (Max) |
|---|---|---|
| 2040 | ₹420 | ₹498 |
Also Read: Adani Power price target, share will increase 10 times.
Trident Share Price Target 2050
According to the past trend of the company, Trident Share Price Target 2050 is going to be between Rs 710 to Rs 830.
| Year | Price Target (Min) | Price Target (Max) |
|---|---|---|
| 2050 | ₹710 | ₹830 |
Latest News
Trident Group to invest ₹3,000 crore in Madhya Pradesh’s textile sector, boosting its workforce from 12,000 to 15,000+. Chairman Rajinder Gupta announced this expansion at the Invest Madhya Pradesh Conclave, highlighting 50% job reservations for women and a focus on sustainable growth.
Strengths
- Promoters hold 73.19% stake in the company, which reflects the confidence in the management.
- The company’s net profit and net profit margin have increased quarter after quarter.
- The company’s debt-to-equity ratio (0.38%) reflects manageable debt levels.
- Well-known brand with established export and domestic network.
- Established player in the textile industry with strong brand recognition.
- Book value per share ₹8.41 and EPS ₹0.63, though low, reflect asset-backed operations.
- The company has large reserves and surplus of ₹3799.50 crores.
- The company pays a dividend of 0.98% to its shareholders.
Risks
- The company’s P/E ratio is significantly higher than the industry average, which indicates overvaluation.
- The company’s profits have declined over the last 3 years.
- The company is not using its capital efficiently to generate profits.
- The company’s net profit has declined by 20.74%, indicating operational challenges or cost pressures.
- Moderate ROE (7.52%) and ROCE (10.4%) point to limited efficiency in generating returns.
- Operating in a highly competitive textile sector may put further pressure on margins.
- Risk from foreign exchange fluctuations, fluctuations in raw material prices and changes in export-import policies.
Sentiment
The current sentiment of Trident is showing strong bearish. It is trading below 5 out of 8 Moving Averages and also trading above 5 out of 9 Oscillators in bullish zone, 2 in bearish zone, and 2 in neutral.
Technical Indicator
According to Investing.com, 8 out of 8 technical indicators are giving sell signal, 0 are giving buy and 0 are giving neutral signal.
| Action | Indicator |
|---|---|
| Buy | 0 |
| Neutral | 0 |
| Sell | 8 |
Trident Share Price History
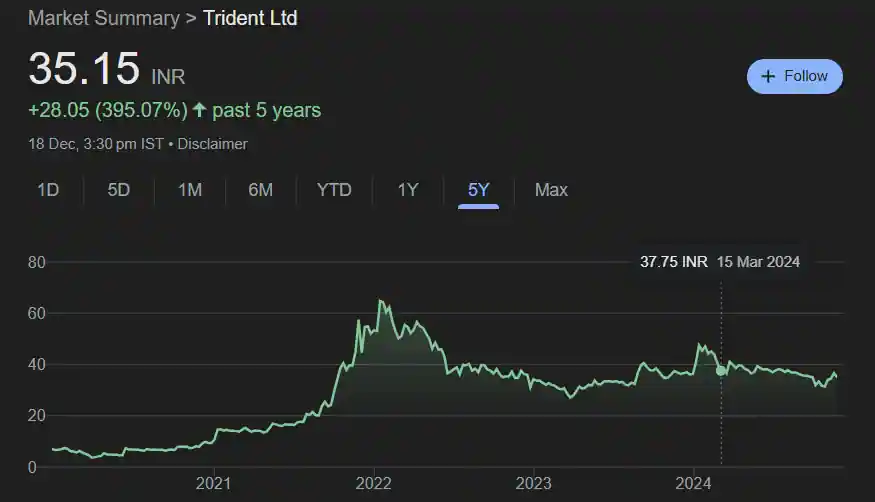
Textile based company Trident was listed on the stock exchange on 21 February 2001 at a price of less than 50 paise. After listing, the company traded below Rs 4 till 2014. Its stock started rising from 2015 and reached Rs 9.80 per share by 2017, after which its stock again fell to Rs 3.65 in March 2020. Its stock started rising from the very next month and by January 2022 it reached Rs 64.80 with a growth of 1675%.
In the last 5 years, the company has given a return of 395% to its investors. However, in the last one year and 6 months, the company has given negative returns of -5.76% and -9.94% respectively.
Also Read: Tata Steel price target, trust of more than 100 years old company.
Trident Quarterly Report
| Description | Sep 24 | Jun 24 | Mar 24 | Dec 23 |
| Revenue + | ₹1721Cr. | ₹1750Cr. | ₹1700Cr. | ₹1837Cr. |
| Expenses + | ₹1621Cr | ₹1648Cr. | ₹1615Cr. | ₹1693Cr. |
| EBITDA | ₹236.08Cr | ₹238.48Cr. | ₹228.42Cr. | ₹273.19Cr. |
| EBIT | ₹145.30Cr | ₹147.88Cr. | ₹133.01Cr. | ₹183.90Cr. |
| Net Profit | ₹83.46Cr | ₹73.59Cr. | ₹64.19Cr. | ₹107.42Cr. |
| Operating Profit Margin | 13.81% | 13.75% | 13.60% | 14.98% |
| Net Profit Margin | 4.88% | 4.24% | 3.82% | 5.89% |
| Earning Per Share | ₹0.17 | ₹0.15 | ₹0.13 | ₹0.21 |
| Dividends Per Share | 0.36 | 0.36 | 0.00 | 0.00 |
Trident Income Report
| Description | Mar 24 | Mar 23 | Mar 22 | Mar 21 |
|---|---|---|---|---|
| Total Revenue | ₹6867Cr | ₹6357Cr | ₹7020Cr | ₹4547Cr |
| Total Expenses | ₹6390Cr | ₹5778Cr | ₹5904Cr | ₹4117Cr |
| Profit/Loss | ₹349.99Cr | ₹441.61Cr | ₹833.75Cr | ₹304.39Cr |
| Net Profit Margin | 5.14% | 6.97% | 11.91% | 6.72% |
| Earning Per Share | ₹0.69 | ₹0.88 | ₹1.67 | ₹0.61 |
| EBITDA | ₹998.20 | ₹971.45 | ₹1535 | ₹807.40 |
| EBIT | ₹633.22 | ₹658.68 | ₹1203 | ₹470.50 |
| Operating Profit Margin | 14.66% | 15.34% | 21.94% | 17.82% |
| Dividends Per share | 0.36 | 0.36 | 0.36 | 0.36 |
Trident Cash Flow
| Particulars | 2023 | 2022 | 2021 | 2020 |
|---|---|---|---|---|
| Opening Cash Balance | ₹271.05Cr. | ₹98.66Cr. | ₹318.85Cr. | ₹10.08Cr. |
| Cash Flow From Operating Activities | ₹1426Cr | ₹902.58Cr. | ₹504.93Cr. | ₹1214Cr. |
| Cash Flow From Investing Activities | ₹-1160Cr | ₹-343.31Cr. | ₹-154.92Cr. | ₹-42.55Cr. |
| Cash Flow From Financing Activities | ₹-410.38Cr | ₹-386.88Cr. | ₹-570.20Cr. | ₹-862.37Cr. |
| Closing Cash Balance | ₹126.73Cr | ₹271.05Cr. | ₹98.66Cr. | ₹318.85Cr. |
| Net Change In Cash | ₹-144.32 | ₹172.39 | ₹-220.19 | ₹308.77 |
Trident Share Price Target 2025, 2026, 2028, 2030, 2040 to 2050
| Year | Price Target (Min) | Price Target (Max) |
|---|---|---|
| 2025 | ₹20 | ₹56 |
| 2026 | ₹47 | ₹83 |
| 2028 | ₹96 | ₹134 |
| 2030 | ₹150 | ₹195 |
| 2040 | ₹420 | ₹498 |
| 2050 | ₹710 | ₹830 |
Also Read: SW Solar price target, guarantee boom in solar sector.
Trident Shareholding Pattern
| Shareholder | Share % |
|---|---|
| Promoter | 73.19% |
| Retail and Others | 24.01% |
| Foreign Institutions | 2.73% |
| Mutual Fund | 0.07% |
| Total | 100.00% |
How to Buy Trident Shares?
Buying and selling of Trident can be done by a stock broker registered with SEBI. Here are the names of some popular brokers.
- Zerodha
- groww
- Angel One
- upstox
Trident Similar Stocks
| Company Name | Mkt Cap | Profit (1Year) | 52W L | 52W H |
|---|---|---|---|---|
| Weizmann | ₹2.03KCr. | 16.12% | ₹126.35 | ₹135.50 |
| Grasim Industries | ₹1.83 LKCr. | 38.87% | ₹2700.70 | ₹2747.95 |
| Go Fashion (India) | ₹6.80 KCr. | -2.28% | ₹1245 | ₹1285 |
| Lux Industries | ₹6.20 KCr | 53.52% | ₹2045 | ₹2084.40 |
| Vardhman Textiles | ₹13.31 KCr. | 24.44% | ₹460 | ₹464.40 |
Trident Share Price Target: Export Opinion
Profitable Stocks
| Stocks | Mkt cap | Profit (1Year) | 52W L | 52W H |
|---|---|---|---|---|
| Adani ports | ₹3.11 LCr | 94.78% | ₹703.00 | ₹1,457.05 |
| Adani Enterprises | ₹3.89 LCr | 40.35% | ₹2142.00 | ₹3457.85 |
| Suzlon Energy | ₹90.75 KCr | 85.69% | ₹33.90 | ₹86.04 |
| Tata Power Company | ₹1.44 LCr | 101.76% | ₹215.70 | ₹464.20 |
| Adani Power | ₹2.92 LCr | 192.93% | ₹231.00 | ₹797.00 |
| Havells India | ₹1.20 LCr | 41.69% | ₹1232.85 | ₹1950.05 |
| Tata Motors | ₹3.57 LCr | 72.86% | ₹557.70 | ₹1065.60 |
| Tata Power | ₹1.44 LCr | 75.52% | ₹230.80 | ₹494.85 |
Conclusion
Trident Limited is a stable mid-cap textile player with a strong market presence and promoter confidence. However, its current high valuation, declining profitability and industry competition pose significant risks. Long-term investors should continue to monitor profit margins and future revenue growth before investing.
Disclaimer– Please note that all the information given here is for general information purpose only and not for investment purposes. Therefore, before investing in any share, take advice from a certified market expert. If you invest, you will be responsible for your profits and losses.
Also Read:
Then don’t say that I didn’t tell you, buy Waaree Energies shares right now.
Tata Gold Price Target, money printing machine for small investors.
Adani Power price target, share will increase 10 times.
Tata Steel price target, trust of more than 100 years old company.
SW Solar price target, guarantee boom in solar sector.
Tata Power share price target, guaranteed returns.
Yatra Online shares will make you rich, 100% guarantee.
Den Networks Share Price Target 2024, to 2050
Venus Pipes Share Price Target 2023 to 2050
Q1. What is the Trident share price target 2025?
Ans: 2025 price target of Trident will be between Rs.20 to Rs.56.
Q2. What is the Trident share price target 2030?
Ans: Trident will trade between Rs 150 and Rs 195 in 2030.
Q3. What is the Trident share price target 2040?
Ans: 2040 price target of Trident will be between Rs.420 to Rs.498.
Q4. What is the Trident share price target 2050?
Ans: 2050 price target of Trident will be between Rs.710 to Rs.830.