This article is going to mainly focus on ITI Share Price Target 2025, 2026, 2028, 2030, 2040 and 2050. Along with this, we will also discuss the company’s Fundamental, sentiment, Income Report, Share Price history, and Quarterly Report. Our analysis will help investors in taking the right decision.
About ITI
ITI Limited is a telecommunications technology enterprise in India, established on 12th October 1948. With manufacturing units in Bengaluru, Naini, Raebareli, Mankapur and Palakkad, along with a R&D centre in Bengaluru and 25 MSP (Marketing, Service and Project) centres across India, ITI Limited has a strong presence across the country.
The company offers a diverse range of products, including telecom solutions such as Gigabit Passive Optical Network (GPON), Managed Leased Line Network (MLLN) products, Wi-Fi access points, radio modems and set-top boxes. ITI also specializes in defense encryption products such as Bulk Encryption Units (BEUs) and Terminal End Secrecy Devices (TESDs). In addition, it manufactures optical fiber cables, smart energy meters, solar panels and smart cards to meet the growing demand for digital infrastructure.
ITI Limited excels in turnkey telecom solutions, providing installation and commissioning services for telecom networks. The company is also expanding its data center in Bengaluru to provide cloud services to government institutions, banks and other sectors.
To remain competitive in the emerging ICT market, ITI is focusing on IoT, smart city solutions and allied telecom services with a special emphasis on encryption technology for defense applications. With its extensive R&D capabilities, ITI Limited will continue to support India’s digital transformation journey.
ITI Fundamental
ITI Limited is a telecommunications technology enterprise in India, with a market capitalization of ₹42289 Crore, which indicates that it is a large-cap company. The company is listed on both NSE and BSE with the code ITI and 523610 respectively. Reserves and surplus of ₹788.58 crore suggest good financial support, which help the company to fight adverse conditions.
Total revenue stood at ₹1308 Crore in FY24, decreasing of 9.67% over ₹1448 Crore in FY23. In the financial year 2024, the company has a loss of 568.92 Crore which has increased by 58.10% as compared to FY 23. The company has been in loss continuously for the last 3 years. Its profit margin is negative which has been showing negative growth continuously for the last 2 years.
ITI’s ROE (negative -30.92%) indicates negative returns. The ROCE is -8.43% which is also negative, indicating negative return on capital employed. However, the debt to equity ratio of 1.05 indicates moderate leverage.
Also Read: Then don’t say that I didn’t tell you, buy Waaree Energies shares right now.
Its price-to-book (P/B) ratio is 28.39, which is exceptionally high. This means that investors are paying a very high premium over book value despite the company’s losses. The company has not paid a dividend in the last few years, which may discourage income-focused investors.
| Description | Value |
|---|---|
| Company Name | ITI Ltd. |
| Sector | Telecom |
| Established | 12 October 1948 |
| Website | itiltd.in |
| Listing At | BSE, NSE |
| BSE Code | 523610 |
| NSE Code | ITI |
| Mkt Cap | ₹42289Cr |
| Reserves and Surplus | ₹788.58Cr |
| ROE | -30.92% |
| ROCE | -8.43% |
| 52 Week High | ₹592.70 |
| 52 Week Low | ₹210 |
| P/E Ratio (TTM) | -84.31 |
| Industry P/E | 42.45 |
| P/B Ratio | 28.39 |
| Face Value | 10 |
| Book Value Per Share | ₹16.89 |
| EPS (TTM) | ₹-5.22 |
| Dividend Yield | 0.00% |
| Debt to Equity | 1.05 |
| Total Revenue | ₹1308Cr |
| Revenue Growth | -9.67% |
| Net Profit (Anual) | ₹-568.92Cr |
| Profit Growth | -58.10% |
Returns in Past Year
| Year | Returns (%) |
|---|---|
| 2024 | 27.12% |
| 2023 | 193.97% |
| 2022 | -12.02% |
| 2021 | -6.95% |
| 2020 | 36.81% |
| 2019 | -1.39% |
| 2018 | -31.78% |
| 2017 | 205.90% |
| 2016 | 46.90% |
| 2015 | 7.18% |
| 2014 | 71.47% |
| 2013 | -25.50 |
| 2012 | 25.21% |
| 2011 | -56.99% |
| 2010 | -14.78% |
| 2009 | 208.23% |
| 2008 | -78.98% |
| 2007 | 69.26% |
Also Read: Tata Gold Price Target, money printing machine for small investors.
ITI Share Price Target 2025
ITI is a 76-year-old company with more than 7 decades of experience and reputation. The stock of ITI will trade between ₹ 270 to ₹ 520.
| Year | Price Target (Min) | Price Target (Max) |
|---|---|---|
| 2025 | ₹270 | ₹520 |
ITI Share Price Target 2026
According to market exports, the price target of ITI for 2026 is going to be between Rs320 to Rs 450.
| Year | Price Target (Min) | Price Target (Max) |
|---|---|---|
| 2026 | ₹320 | ₹450 |
Also Read: Venus Pipes Share Price Target 2023 to 2050
ITI Share Price Target 2028
According to market experts, the price target of ITI for 2028 is going to be between Rs 370 to Rs 510.
| Year | Price Target (Min) | Price Target (Max) |
|---|---|---|
| 2028 | ₹370 | ₹510 |
GTL Infra Share Price Target 2030
According to market experts, ITI Share Price Target 2030 is going to be between Rs440 to Rs 600.
| Year | Price Target (Min) | Price Target (Max) |
|---|---|---|
| 2030 | ₹440 | ₹600 |
ITI Share Price Target 2040
According to the past trend of the company, ITI Share Price Target 2040 is going to be between Rs 960 to Rs 1180.
| Year | Price Target (Min) | Price Target (Max) |
|---|---|---|
| 2040 | ₹960 | ₹1180 |
Also Read: Adani Power price target, share will increase 10 times.
ITI Share Price Target 2050
According to the past trend of the company, ITI Share Price Target 2050 is going to be between Rs1620 to Rs 1870.
| Year | Price Target (Min) | Price Target (Max) |
|---|---|---|
| 2050 | ₹1620 | ₹1870 |
Latest News
Strengths
- The company’s price is above the short, medium, long term moving average.
- The company’s revenue has shown good growth in the last 4 quarters.
- 90% stake in the company is held by promoters, which shows confidence in the company.
- The company has a reserve of Rs 788.58 crore.
- The company’s losses have reduced in the last quarter.
- ITI Ltd is a government-owned company.
Risks
- The company is unable to generate profit by using capital.
- The company is unable to use shareholder funds effectively.
- The company’s ROE has decreased in the last 2 years.
- The company’s revenue has been declining for several years.
- The company has been continuously in losses for the last several years.
- The company does not pay any dividend to its investors.
- The company’s negative net profit margin shows its inability to generate profit.
- Its debt to equity ratio (1.05) indicates that the company is in debt.
- Despite the losses, the company’s P/B ratio is very high.
- The company operates in a competitive sector with big players present.
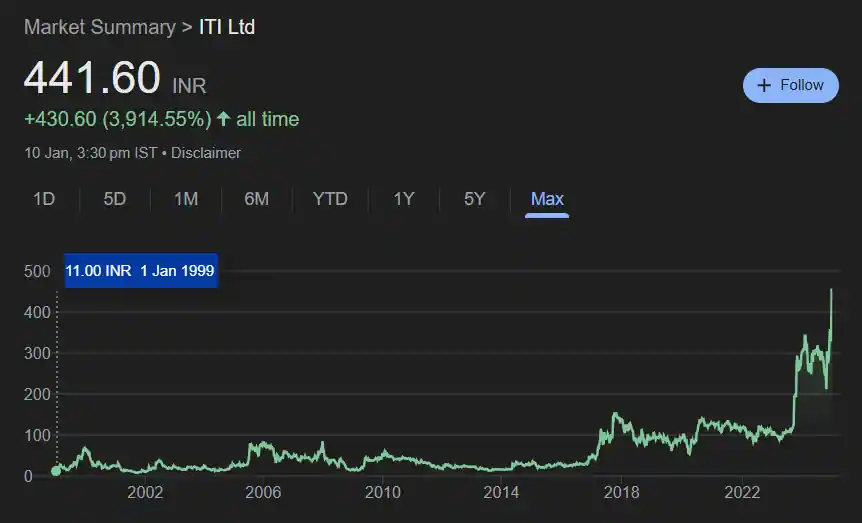
ITI Share Price History
Also Read: Tata Steel price target, trust of more than 100 years old company.
ITI Quarterly Income Report
| Description | Sep 24 | Jun 24 | Mar 24 | Dec23 |
| Revenue + | ₹1031Cr. | ₹535.02Cr. | ₹610.55Cr. | ₹271.48Cr. |
| Expenses + | ₹1100Cr | ₹599.63Cr. | ₹849.49Cr. | ₹373.17Cr. |
| EBITDA | ₹6.09Cr | ₹2.42Cr. | ₹-164.54Cr. | ₹-30.85Cr. |
| EBIT | ₹-8.85Cr | ₹-37.93Cr. | ₹-178.72Cr. | ₹-44.44Cr. |
| Net Profit | ₹-70.11Cr | ₹-91.08Cr. | ₹-238.94Cr. | ₹-101.69Cr. |
| Operating Profit Margin | 0.51% | -4.63% | -27.36% | -11.92% |
| Net Profit Margin | -6.81% | -12.43% | -39.74% | -39.29% |
| Earning Per Share | ₹-0.73 | ₹-0.95 | ₹-2.49 | ₹-1.05 |
| Dividends Per Share | 0.00 | 0.00 | 0.00 | 0.00 |
ITI Annual Income Report
| Description | Mar 24 | Mar 23 | Mar 22 | Mar 21 |
|---|---|---|---|---|
| Total Revenue | ₹1308Cr | ₹1448Cr | ₹2115Cr | ₹2524Cr |
| Total Expenses | ₹1877Cr | ₹1808Cr | ₹1995Cr | ₹2512Cr |
| Profit/Loss | ₹-568.92Cr | ₹-359.85Cr | ₹-118.71Cr | ₹9.48Cr |
| Net Profit Margin | -45.02% | -25.79% | 6.38% | 0.40% |
| Earning Per Share | ₹-5.93 | ₹-3.81 | ₹1.29 | ₹0.12 |
| EBITDA | ₹-274.41 | ₹-100.77 | ₹361.95 | ₹210.92 |
| EBIT | ₹-327.53 | ₹-150.27 | ₹310.94 | ₹169.07 |
| Operating Profit Margin | -21.72% | -7.22% | 19.45% | 8.93% |
| Dividends Per share | 0.00 | 0.00 | 0.50 | 0.00 |
ITI Cash Flow
| Particulars | 2023 | 2022 | 2021 | 2020 |
|---|---|---|---|---|
| Opening Cash Balance | ₹15.57Cr. | ₹27.94Cr. | ₹39.78Cr. | ₹26.70Cr. |
| Cash Flow From Operating Activities | ₹-293.54Cr | ₹-437.45Cr. | ₹94.07Cr. | ₹-198.65Cr. |
| Cash Flow From Investing Activities | ₹46.21Cr | ₹178.24Cr. | ₹-304.39Cr. | ₹-73.11Cr. |
| Cash Flow From Financing Activities | ₹241.12Cr | ₹246.84Cr. | ₹198.47Cr. | ₹284.84Cr. |
| Closing Cash Balance | ₹9.36Cr | ₹15.57Cr. | ₹27.94Cr. | ₹39.78Cr. |
| Net Change In Cash | ₹-6.21 | ₹-12.37 | ₹-11.84 | ₹13.08 |
ITI Share Price Target 2025, 2026, 2028, 2030, 2040 to 2050
| Year | Price Target (Min) | Price Target (Max) |
|---|---|---|
| 2025 | ₹270 | ₹520 |
| 2026 | ₹320 | ₹450 |
| 2028 | ₹370 | ₹510 |
| 2030 | ₹440 | ₹600 |
| 2040 | ₹960 | ₹1180 |
| 2050 | ₹1620 | ₹1870 |
Also Read: SW Solar price target, guarantee boom in solar sector.
ITI Shareholding Pattern
| Shareholder | Share % |
|---|---|
| Promoter | 90% |
| Other Domestic Institution | 0.01% |
| Retail and Others | 9.92% |
| Foreign Institution | 0.04% |
| Mutual Funds | 0.03% |
| Total | 100.00% |
How to Buy ITI Shares?
Buying and selling of ITI can be done by a stock broker registered with SEBI. Here are the names of some popular brokers.
- Zerodha
- groww
- Angel One
- upstox
ITI Similar Stocks
| Company Name | Mkt Cap | Profit (1Year) | 52W L | 52W H |
|---|---|---|---|---|
| Tejas Networks | ₹18.65 KCr. | 22.94% | ₹651.25 | ₹1495 |
| Astra Micro Wave | ₹7.25 KCr. | 26% | ₹510.10 | ₹1059 |
| GTL Infrastructure | ₹179.48 KCr. | -35.35% | ₹9.20 | ₹19.45 |
ITI Share Price Target: Export Opinion
Profitable Stocks
| Stocks | Mkt cap | Profit (1Year) | 52W L | 52W H |
|---|---|---|---|---|
| TCS | ₹1544LCr | 14.87% | ₹3591.50 | ₹4592.25 |
| Adani Enterprises | ₹3.89 LCr | 40.35% | ₹2142.00 | ₹3457.85 |
| Suzlon Energy | ₹90.75 KCr | 85.69% | ₹33.90 | ₹86.04 |
| Tata Power Company | ₹1.44 LCr | 101.76% | ₹215.70 | ₹464.20 |
| Adani Power | ₹2.92 LCr | 192.93% | ₹231.00 | ₹797.00 |
| Bharti Airtel | ₹9.66 LCr | 51.59% | ₹1051.60 | ₹1779 |
| Tata Motors | ₹3.57 LCr | 72.86% | ₹557.70 | ₹1065.60 |
| Tata Power | ₹1.44 LCr | 75.52% | ₹230.80 | ₹494.85 |
Conclusion
ITI Limited is a government-owned company. However, the company is currently struggling with profitability, high debt and negative cash flow. Its fundamentals are weak and it faces stiff competition from private companies.
Investors should be cautious as the company’s financial position indicates significant risk. However, it may have long-term potential if the government initiates reforms or strategic initiatives for its revival.
Disclaimer– Please note that all the information given here is for general information purpose only and not for investment purposes. Therefore, before investing in any share, take advice from a certified market expert. If you invest, you will be responsible for your profits and losses.
Also Read:
Then don’t say that I didn’t tell you, buy Waaree Energies shares right now.
Tata Gold Price Target, money printing machine for small investors.
Adani Power price target, share will increase 10 times.
Tata Steel price target, trust of more than 100 years old company.
SW Solar price target, guarantee boom in solar sector.
Tata Power share price target, guaranteed returns.
Yatra Online shares will make you rich, 100% guarantee.
Den Networks Share Price Target 2024, to 2050
Venus Pipes Share Price Target 2023 to 2050
Q1. What is the ITI share price target 2025?
Ans: 2025 price target of ITI will be between Rs.270 to Rs.520.
Q2. What is the ITI share price target 2030?
Ans: ITI will trade between Rs440 and Rs600 in 2030.
Q3. What is the ITI share price target 2040?
Ans: 2040 price target of ITI will be between Rs.960 to Rs.1180.
Q4. What is the ITI share price target 2050?
Ans: 2050 price target of ITI will be between Rs.1620 to Rs.1870.